Example 1: PyIRI Validation using PyVALION GIRO Data
PyIRTAM can calculate daily ionospheric parameters for the user provided IRTAM coefficients and grid. The estimation of the parameters occurs simultaneously at all grid points and for all desired diurnal time frames.
Import libraries.
import PyVALION
import PyIRI
import datetime
import numpy as np
import pandas as pd
import os
import pickle
2. Specify a directory on your machine where to save downloaded GIRO data and results.
data_save_dir = '/home/GIRO_Data/'
save_res_dir = '/home/Save/'
name_run = 'PyIRI_Validation'
Select the desired day for validation.
year = 2024
month = 7
day = 1

# Create a datetime object for the selected day
dtime = datetime.datetime(year, month, day)
print('Validation day is: ', dtime)
4. Create an array for the model’s time resolution. In this example, we use 15-minute resolution.
atime = pd.to_datetime(np.arange(dtime,
                                 dtime + datetime.timedelta(days=1),
                                 datetime.timedelta(minutes=15)))

# Convert atime to an array of decimal hours
aUT = atime.hour + atime.minute / 60. + atime.second / 3600.
Provide the F10.7 value for this day. You can look it up at OMNIWeb.
F107 = 174.
Create a model grid.
dlon = 4.
dlat = 2.
dalt = 10.
alon = np.arange(-180., 180. + dlon, dlon)
alat = np.arange(-90., 90. + dlat, dlat)
alon_reg_2d, alat_reg_2d = np.meshgrid(alon, alat)
aalt = np.arange(100., 1000., dalt)

# Sizes of the grid
N_lon = alon.size
N_lat = alat.size
N_time = aUT.size
N_alt = aalt.size

# Flatten grid arrays for PyIRI input
alon_reg = np.reshape(alon_reg_2d, alon_reg_2d.size)
alat_reg = np.reshape(alat_reg_2d, alon_reg_2d.size)
Run PyIRI.
F2, _, _, _, _, _, den = PyIRI.main_library.IRI_density_1day(dtime.year,
                                                             dtime.month,
                                                             dtime.day,
                                                             aUT,
                                                             alon_reg,
                                                             alat_reg,
                                                             aalt,
                                                             F107,
                                                             PyIRI.coeff_dir,
                                                             ccir_or_ursi=1)
8. Record the model outputs into a dictionary. When using your own model, match the format to this dictionary. Ensure that all arrays in the model dictionary have the same shape otherwise, a single forward operator G cannot be applied to all of them consistently. Ensure that NmF2 is in (m$^{-3}), hmF2 is in (km), B1 is in (km), and B0 is unitless.
model = {}
model['NmF2'] = np.reshape(F2['Nm'], (N_time, N_lat, N_lon))
model['hmF2'] = np.reshape(F2['hm'], (N_time, N_lat, N_lon))

# A dictionary to hold the units of the model outputs
units = {}
units['NmF2'] = 'm$^{-3}$'
units['hmF2'] = 'km'

print('The model output has the following', len(model),
    'parameters with shape (N_time, N_lat, N_lon): ')
for key in model:
    print(key, ', shape ', model[key].shape)
9. Open the list of GIRO ionosondes (provided by the PyVALION module). If you need to exclude certain ionosondes, modify the giro_name[‘name’] array.
file_ion_name = os.path.join(PyVALION.giro_names_dir, 'GIRO_Ionosondes.p')
giro_name = pickle.load(open(file_ion_name, 'rb'))
Download all GIRO ionosonde parameters for the validation time.
raw_data = PyVALION.library.download_GIRO_parameters(atime[0],
                                                     atime[-1],
                                                     giro_name['name'],
                                                     data_save_dir,
                                                     save_res_dir,
                                                     name_run,
                                                     clean_directory=True,
                                                     filter_CS=90)
11. Create a forward operator for the ionosonde dataset using the given model grid.
obs_data, obs_units, G, obs_info = PyVALION.library.find_G_and_y(atime,
                                                                 alon,
                                                                 alat,
                                                                 raw_data,
                                                                 save_res_dir,
                                                                 name_run,
                                                                 'bilinear',
                                                                 True)
Find residuals between the observed data and model forecast.
model_data, residuals, model_units, res_ion = PyVALION.library.find_residuals(model,
                                                                              G,
                                                                              obs_data,
                                                                              obs_info,
                                                                              units)
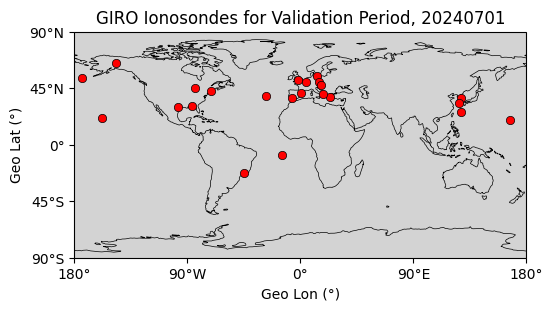
13. Create a map showing the locations of GIRO ionosondes used on the selected validation day.
PyVALION.plotting.plot_ionosondes(obs_info,
                                  dtime,
                                  save_res_dir,
                                  plot_name='Ionosondes_Map')
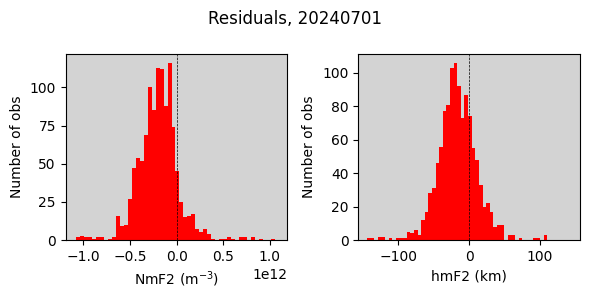
Create a histogram of residuals between model data and observations.
PyVALION.plotting.plot_histogram(residuals,
                                 model_units,
                                 dtime,
                                 save_res_dir,
                                 plot_name='Residuals')
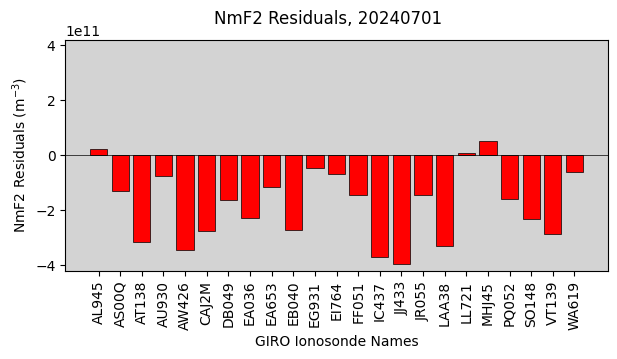
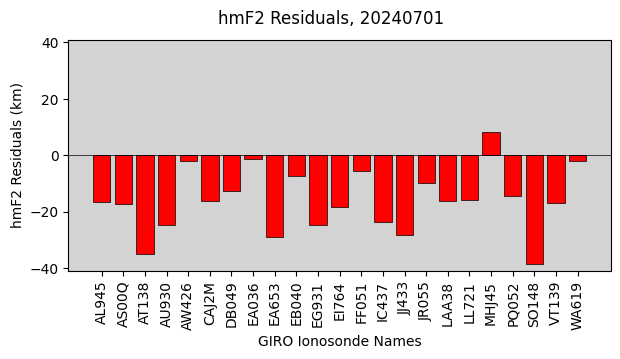
15. Create a plot with mean residuals between model data and observations for each ionosonde
PyVALION.plotting.plot_individual_mean_residuals(res_ion,
                                                 obs_info,
                                                 model_units,
                                                 dtime,
                                                 save_res_dir,
                                                 plot_name='IonRes')