Example 1: PyIRI Validation using PyVALION Jason Data
PyIRTAM can calculate daily ionospheric parameters for the user provided IRTAM coefficients and grid. The estimation of the parameters occurs simultaneously at all grid points and for all desired diurnal time frames.
Import libraries.
import PyVALION
import PyIRI
import datetime
import numpy as np
import pandas as pd
import os
import pickle
import netCDF4
import siphon
import tqdm
2. Specify a directory on your machine where to save downloaded Jason data and results.
data_save_dir = '/home/Jason_Data/'
save_res_dir = '/home/Save/'
name_run = 'PyIRI_Validation'
Select the desired day for validation.
year = 2024
month = 7
day = 1

# Create a datetime object for the selected day
dtime = datetime.datetime(year, month, day)
print('Validation day is: ', dtime)
4. Create an array for the model’s time resolution. In this example, we use 15-minute resolution.
atime = pd.to_datetime(np.arange(dtime,
                                 dtime + datetime.timedelta(days=1),
                                 datetime.timedelta(minutes=15)))

# Convert atime to an array of decimal hours
aUT = atime.hour + atime.minute / 60. + atime.second / 3600.
5. Provide the F10.7 value for this day. You can look it up at OMNIWeb: https://omniweb.gsfc.nasa.gov/form/dx1.html
F107 = 174.
Create a model grid.
ddeg = 5.
dalt = 10.
alon = np.arange(-180., 180. + ddeg, ddeg)
alat = np.arange(-90., 90. + ddeg, ddeg)
alon_reg_2d, alat_reg_2d = np.meshgrid(alon, alat)
aalt = np.arange(100., 1000., dalt)

# Sizes of the grid
N_lon = alon.size
N_lat = alat.size
N_time = aUT.size
N_alt = aalt.size

# Flatten grid arrays for PyIRI input
alon_reg = np.reshape(alon_reg_2d, alon_reg_2d.size)
alat_reg = np.reshape(alat_reg_2d, alon_reg_2d.size)
Run PyIRI.
_, _, _, _, _, _, den = PyIRI.main_library.IRI_density_1day(dtime.year,
                                                             dtime.month,
                                                             dtime.day,
                                                             aUT,
                                                             alon_reg,
                                                             alat_reg,
                                                             aalt,
                                                             F107,
                                                             PyIRI.coeff_dir,
                                                             ccir_or_ursi=1)
Compute TEC from PyIRI electron density outputs up to the altitude of Jason satellites (1336 km).
TEC_IRI = PyIRI.main_library.edp_to_vtec(den,
                                         aalt,
                                         min_alt=0.0,
                                         max_alt=1336.0)
9. Record the model outputs into a dictionary. When using your own model, match the format to this dictionary. Ensure that TEC is in (TECU).
model = {}
model['TEC'] = np.reshape(TEC_IRI, (N_time, N_lat, N_lon))

# A dictionary to hold the units of the model outputs
units = {}
units['TEC'] = 'TECU'

print('The model output has the following', len(model),
    'parameters with shape (N_time, N_lat, N_lon): ')
for key in model:
    print(key, ', shape ', model[key].shape)
10. Download the jason_manifest.txt file (provided by PyVALION) and save locally into data_save_dir. A local copy of the manifest will be updated with new THREDDs file location data if available.
11. Download all raw Jason TEC data for the validation time. If you need to exclude certain satellites, modify the sat_names array.
sat_names = np.array(["JA2", "JA3"])
raw_data = PyVALION.library.download_Jason_TEC(atime[0],
                                               atime[-1],
                                               data_save_dir,
                                               name_run=name_run,
                                               save_data_option=True,
                                               include_neg=True,
                                               sat_names=sat_names)
Downsample Jason TEC data to match model resolution.
data = PyVALION.library.downsample_Jason_TEC(raw_data,
                                             ddeg,
                                             save_dir=data_save_dir,
                                             name_run=name_run,
                                             save_data_option=True)
13. Create a forward operator for the Jason TEC dataset using the given model grid.
obs_data, obs_units, G = PyVALION.library.find_Jason_G_and_y(atime,
                                                             alon,
                                                             alat,
                                                             data)
Find residuals between the observed data and model forecast.
model_data, residuals, model_units = PyVALION.library.find_Jason_residuals(model,
                                                                           G,
                                                                           obs_data,
                                                                           units)
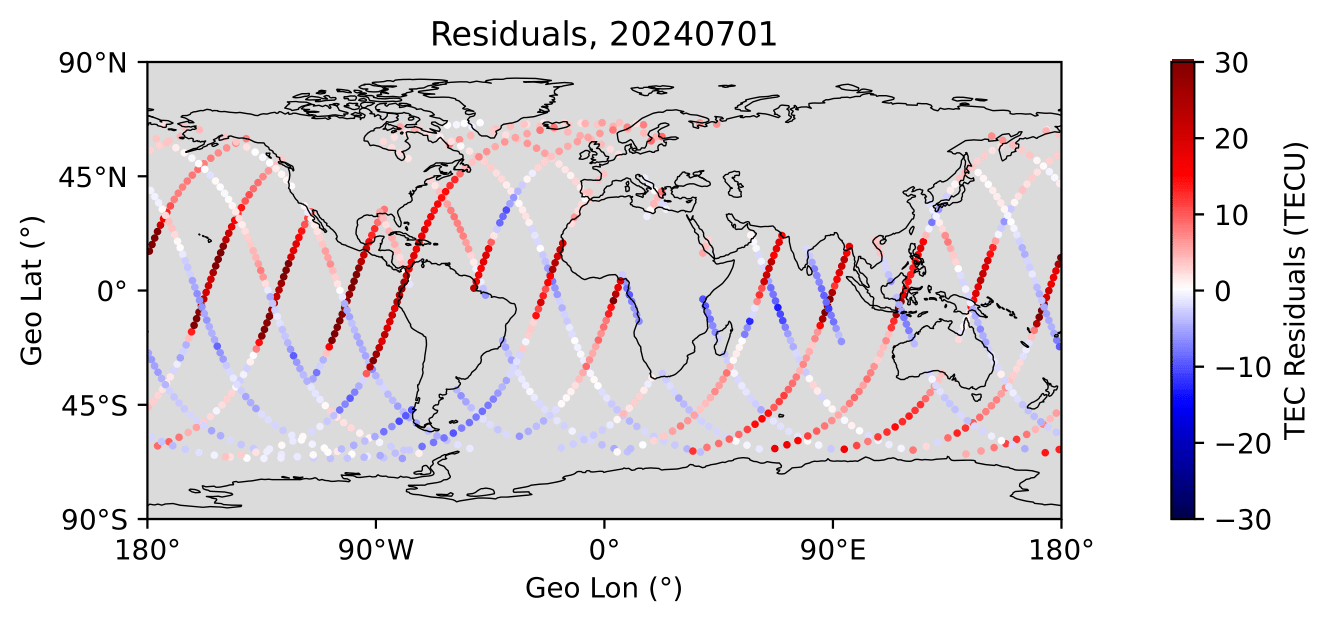
Create a map showing the residuals between model and data observations.
fig = PyVALION.plotting.plot_TEC_residuals_map(obs_data['lat'],
                                               obs_data['lon'],
                                               residuals,
                                               atime[0],
                                               save_option=True,
                                               save_dir=save_img_dir,
                                               plot_name='TEC_Residuals_Map')
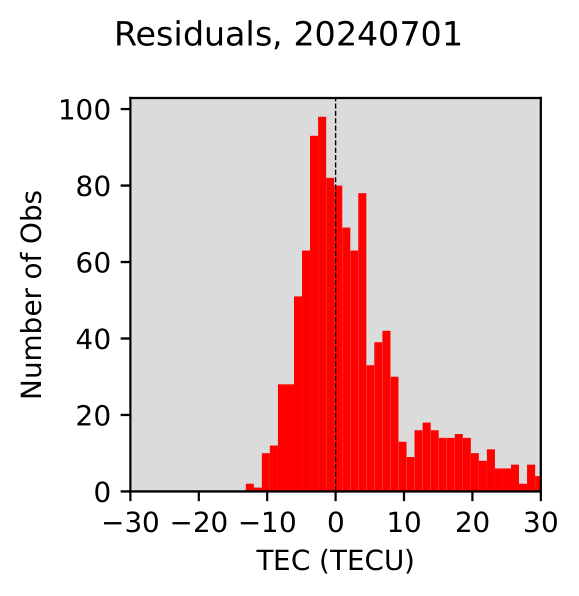
Create a histogram of residuals between model data and observations.
fig = PyVALION.plotting.plot_TEC_residuals_histogram(residuals,
                                                     model_units,
                                                     atime[0],
                                                     save_option=True,
                                                     save_dir=save_img_dir,
                                                     plot_name='TEC_Residuals')